
Why SaaS Cold Email Template Benchmarks Are Misleading
Every SaaS team that runs outbound eventually asks the same question: is our reply rate any good? The usual answer comes from a template library or a blog post that says a good cold email gets "3 to 5%" replies. Teams then compare their own number against that figure, decide their template is broken, and rewrite it.
Most of the time the template was not the problem. The benchmark was.
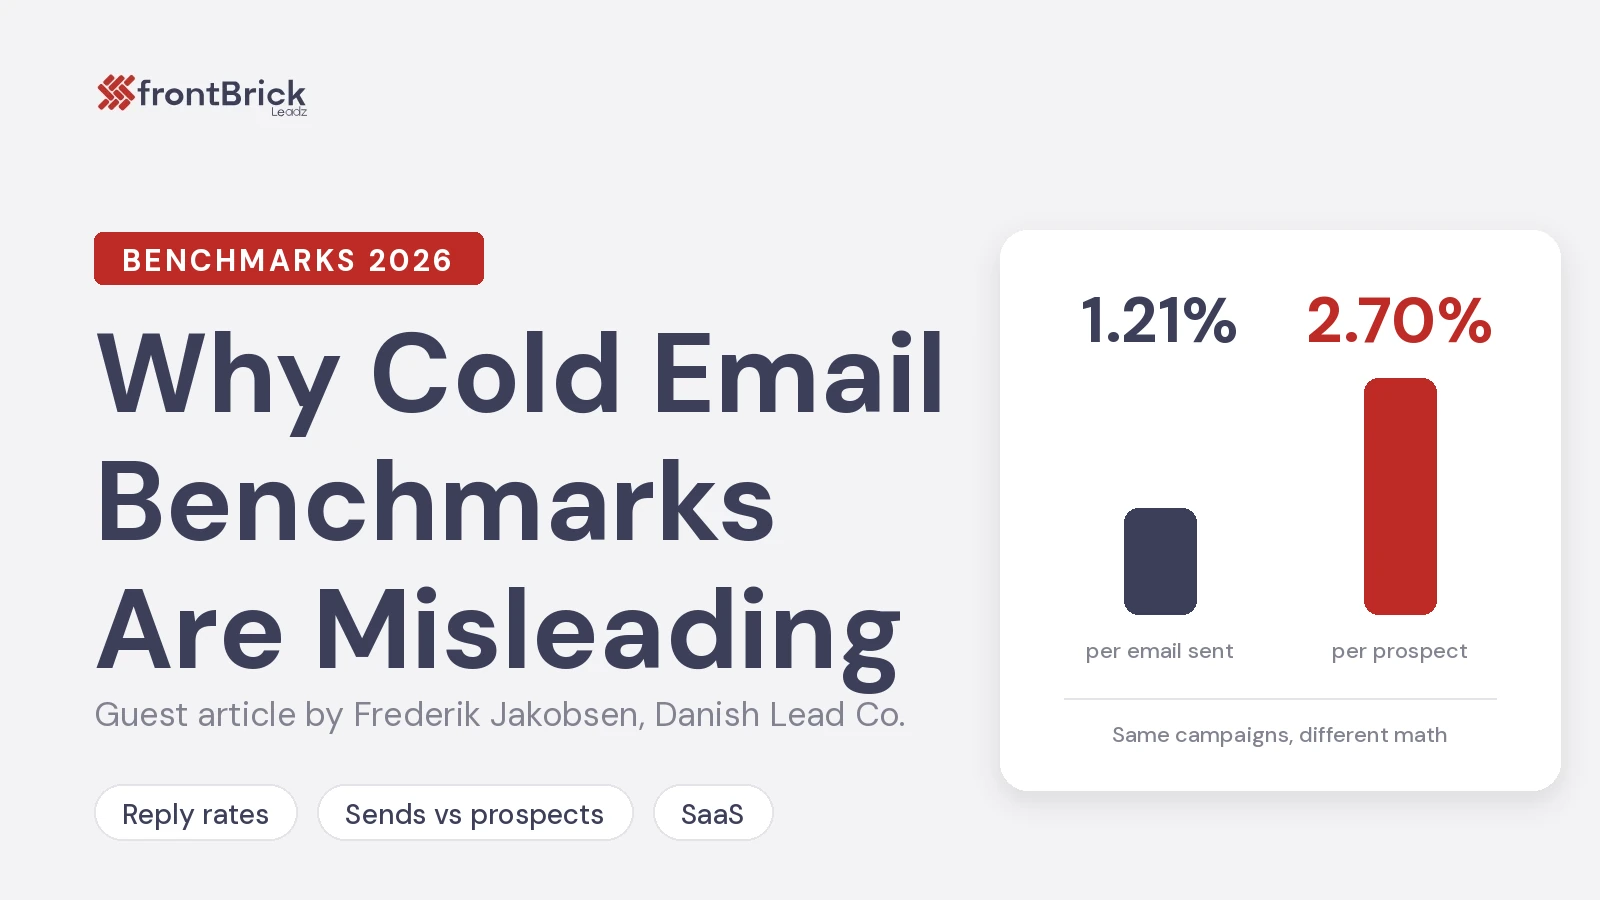
At Danish Lead Co we run cold email programmes for B2B companies, and we published our own numbers from 1,160,919 client emails sent across 344 campaigns for 45 clients over 90 days (25 June to 23 September 2026). The reply rate was 1.21% of emails sent. Measured against unique prospects contacted, the same replies come to 2.70%. The full method and table are on our cold email benchmarks page.
Those two figures describe the same campaigns. The only difference is what you divide by. That difference is why most published template benchmarks cannot be compared with anything, including your own results.
The denominator problem
A reply rate is a fraction. On top: replies. On the bottom: either emails sent or people contacted. Most published benchmarks never say which.
A typical SaaS sequence sends two or three emails to each prospect. If you count replies against prospects, every prospect who replies to any step of the sequence counts once, but the prospect only sits in the denominator once too. If you count against emails sent, the same reply is divided by every step that went out.
In our data that alone more than doubles the number: 1.21% per email becomes 2.70% per prospect. Nothing about the copy changed. Nothing about the list changed. The number just looks twice as good.
So when a template page tells you its emails get 4%, the first question is not "what did they write?" It is "4% of what?"
A worked example
Here is how one campaign can produce three different "reply rates". The numbers below are illustrative, chosen to keep the arithmetic simple.
A SaaS team contacts 1,000 prospects with a three-step sequence. Not everyone receives every step (some reply early, some bounce, some unsubscribe), so the campaign sends 2,500 emails in total. It gets 30 replies. Six of those are out-of-office notices.
- Against prospects, counting everything: 30 / 1,000 = 3.0%
- Against emails sent, counting everything: 30 / 2,500 = 1.2%
- Against emails sent, excluding out-of-office: 24 / 2,500 = 0.96%
All three numbers are honest. They describe the same 1,000 people and the same template. Yet the first one fits neatly inside the "3 to 5%" folklore, and the last one looks like a campaign in trouble.
Now imagine the team reads a template library claiming 4%, then looks at its dashboard. If the tool reports against sends, the team sees 1.2% and concludes the template is failing. If the tool reports against prospects, the team sees 3.0% and concludes it is close. Neither conclusion says anything about the copy.
Now add a fourth step to the sequence. Suppose it sends 700 more emails and brings in five more replies. Against prospects, the rate rises to 3.5%, and the extra step looks like a win. Against sends, the rate falls slightly, from 1.2% to about 1.1%, because the extra volume added proportionally fewer replies. The strict measure tells you something the soft one hides: the fourth step costs sending reputation for very little return.
This is why the choice of denominator is not an academic detail. It changes which decisions look right.
Out-of-office replies inflate it further
The second problem is what counts as a reply. Most sending tools count every inbound message. That includes out-of-office notices, "please remove me", and automatic ticket acknowledgements.
In our dataset, out-of-office replies were 20.5% of all replies: 2,883 of 14,058. Take them out and the reply rate against sends drops from 1.21% to 0.96%. A benchmark that counts those messages as engagement is partly measuring how many of your prospects were on holiday.
Combine both effects (count against prospects, include auto-responses) and you get a number that looks roughly twice as good as the same campaign measured strictly against sends. That is where most of the "3 to 5%" folklore comes from. It is not invented. It is just measured with a softer denominator and a looser definition of a reply.
Why this matters more for SaaS teams
SaaS teams test templates more than most. They run A/B tests on subject lines, swap openers, try a shorter version, try a case study version. Each test is judged against a benchmark, and the benchmark decides whether the test "won".
If the benchmark is inflated, three things go wrong:
- Good templates get killed. A sequence running at 1.5% against sends is above our average and well above the median campaign in our data (1.05%). Judged against a 4% "benchmark", it looks like a failure and gets rewritten.
- The wrong lever gets pulled. When the reply rate looks low, teams rewrite copy. Often the real issue is the list, the targeting, or deliverability, and no template change will fix those.
- Forecasts break. Pipeline models built on 4% replies promise twice the meetings the programme will produce. Sales leadership then loses faith in outbound, when the programme was performing normally all along.
What a realistic range looks like
An average hides a wide spread, so here is what sat inside our 1.21%. Across the 112 campaigns that sent at least 1,000 emails (99.7% of all volume):
- Bottom 10% of campaigns: 0.42%
- Median campaign: 1.05%
- Top 10% of campaigns: 2.25%
- Best campaign in the window: 3.87%
The best campaign ran at about 9x the bottom decile. That spread is the useful part. It tells you that targeting, offer and copy matter a lot, but it also tells you that 3.87% against sends was the best result across hundreds of campaigns, not a normal Tuesday.
The average also includes every test that lost. We ran 1,244 copy variants across 283 campaign builds in the window, about 4.4 per campaign. Most variants lose, which is the point of testing, and every losing variant is inside that 1.21%. Treat the average as a floor for a programme that is still testing, not a ceiling for one that has found its angle.
Reply rate is not the number that pays
Even a correctly measured reply rate is a weak target, because it counts rejections too. A "no thanks" and a "send me times for Thursday" both count as one reply.
The number that tracks pipeline is positive replies per email sent. In our data, 14.07% of classified replies were positive (a real question, a request for a call, or a referral), which works out at 0.17% of all emails sent. That is the figure we plan meetings from.
For a SaaS team, this changes how you judge a template test. A version that gets fewer replies but more positive ones is the better template, even if a dashboard ranks it lower.
How to benchmark your own templates honestly
You do not need a perfect industry benchmark. You need a consistent internal one. Here is the method we use.
- Pick one denominator and write it down. Emails sent is the stricter and more useful choice, because it penalises long sequences that add volume without adding replies.
- Separate auto-responses. Exclude out-of-office and ticket acknowledgements from replies before you calculate anything.
- Track positive replies per email sent as the main metric. Reply rate stays on the dashboard, but decisions are made on positives.
- Compare like with like. If your tool reports against prospects, compare it to 2.70%. If it reports against sends, compare it to 1.21%. If it does not say, assume it counts prospects and includes auto-responses, and expect it to look about twice as good as a strict figure.
- Give a test enough volume. A few hundred sends per variant is not enough to separate a 1% template from a 1.5% one. Let each variant reach a meaningful send count before you call a winner.
- Check deliverability before copy. If a campaign suddenly drops, look at bounces and inbox placement first. Our bounce rate across the study was 2.58% because every address is verified before sending. Unverified lists routinely bounce far higher, and no template survives that.
When the template really is the problem
Sometimes the copy is the issue. The signs are fairly clear once your measurement is clean:
- Replies are coming in, but positives are near zero. The offer or the ask is wrong, not the open.
- Replies are mostly "who are you?" or "not relevant". The targeting and the first line do not connect.
- One variant consistently beats another on positives over a real sample. That is a genuine copy signal, and it is worth acting on.
If you are below the median on a strict measure, with a clean list and healthy deliverability, then rewriting the template is the right move. If you are above it and only look bad against a "3 to 5%" headline, leave the template alone and work on volume, targeting or follow-up instead.
Some teams decide they would rather not build all of this in-house. Working with a cold email agency that reports against sends and separates positives from auto-responses is one way to get honest numbers from day one. frontBrick's guide to the best cold email agencies is a good place to compare options if you go that route.
The takeaway
Template benchmarks are not wrong because people lie about them. They are misleading because nobody states the denominator, and because auto-responses get counted as engagement. The same campaign can honestly be described as 1.21% or 2.70%, and a template page quoting 4% might be describing a perfectly average sequence.
Before you rewrite a template, measure it against sends, strip out auto-responses, and judge it on positive replies. You may find it was working all along.
FAQ
What is a good cold email reply rate for SaaS in 2026?
Across our 344 client campaigns, the average was 1.21% against emails sent and 2.70% against unique prospects. The median campaign ran 1.05% against sends and the top 10% ran 2.25%. Above 4% against sends usually means a warm list or a different denominator.
Why do template libraries quote 3 to 5%?
Usually because they count replies against prospects instead of emails sent, and include out-of-office messages as replies. Both make the number look about twice as high as a strict measure of the same campaign.
Should I measure reply rate per email or per prospect?
Per email sent. It is stricter, and it shows whether extra follow-up steps add replies or just add volume.
What metric should decide an A/B test?
Positive replies per email sent. A version with fewer total replies but more positive ones is the better template.
How many sends does a template test need?
More than most teams give it. With reply rates around 1%, a few hundred sends per variant cannot separate small differences reliably. Let each variant build real volume before you pick a winner.
About the author
Frederik Jakobsen is the founder of Danish Lead Co., a B2B outbound agency based in Aarhus, Denmark, that runs cold email for niches like private equity and M&A. He is a guest author for frontBrick. Danish Lead Co. has booked 10,000+ qualified meetings for 110+ B2B companies since 2021.

11 Best Cold Email Agencies for B2B in 2026: Pricing and Proof
The 11 cold email agencies B2B buyers see most in AI answers and Google, with public pricing, published proof and a buyer checklist.
 Stan Stojanovic
How to Measure Account-Based Marketing ROI
A practical ABM measurement guide covering costs, attribution, pipeline, and realized profit.
 Natalija Ilic
How to find someone's work email address for B2B outreach
Find and verify work email addresses for relevant B2B outreach.
Natalija Ilic